
GetYourGuide Analytics: How to Read the Performance Section
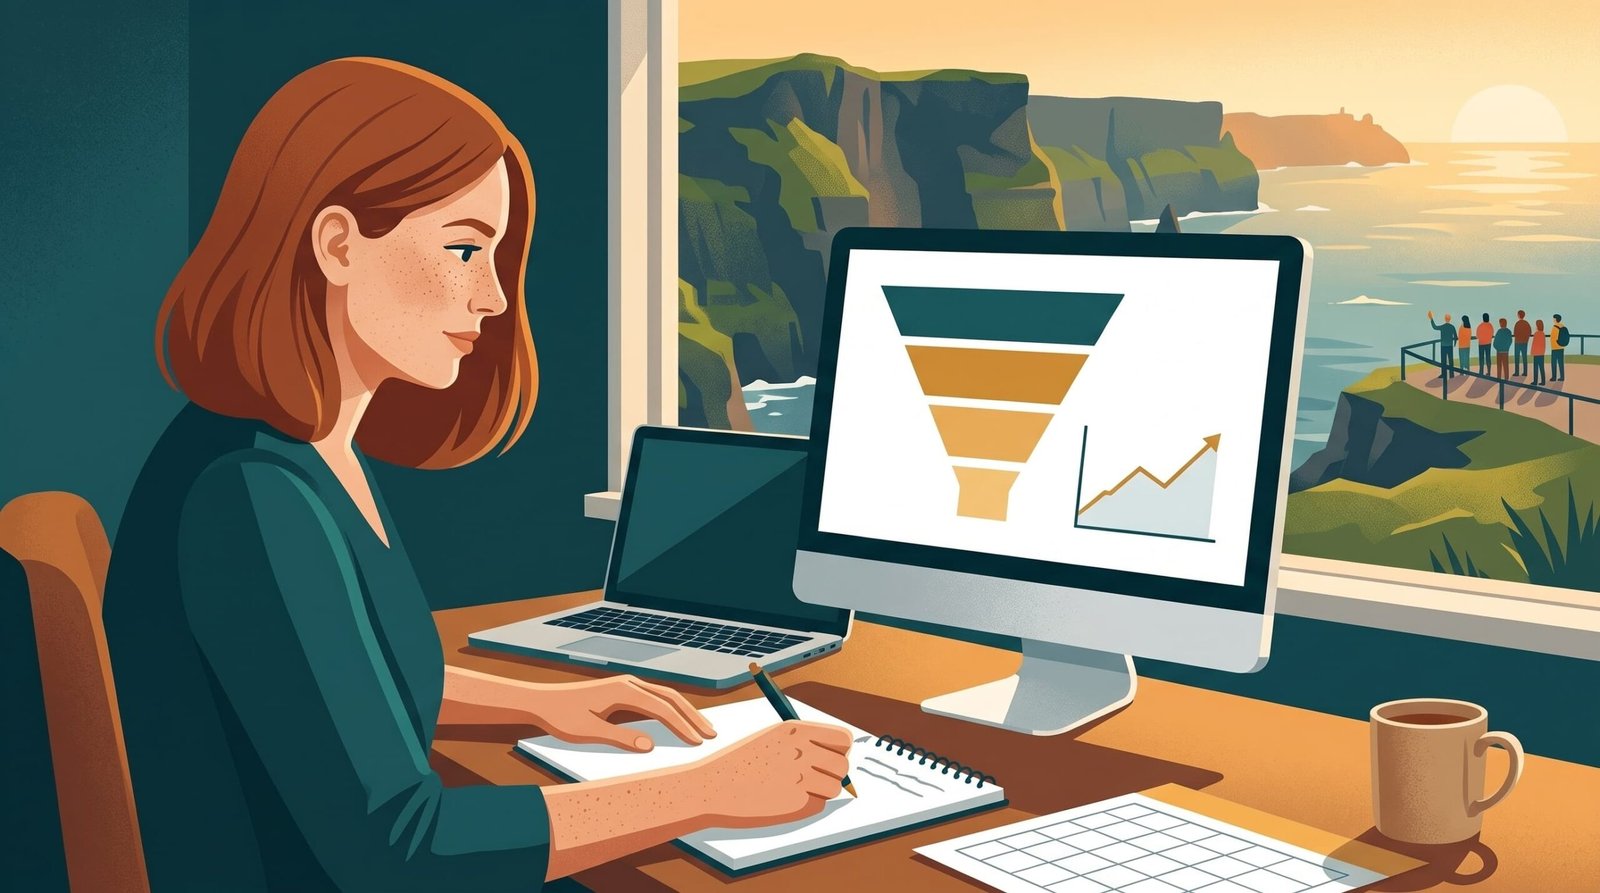
GetYourGuide analytics are in the Performance section of the Supplier Portal, which replaced the old Analytics area in spring 2026. It has a business view covering all your products and a product view for each activity, showing revenue, bookings, conversion rate, ratings, cancellations, source markets and booking window. The data updates once a day.
GetYourGuide shows operators more data than most OTAs. It explains far less about what to do with it. The help centre tells you where to click, and the Growth Hub article that used to explain how to use the numbers has been taken down.
This guide covers the part in between: which numbers to read first, how to read a product’s page as a funnel, and which GetYourGuide setting each weak number points to. It also covers what the dashboard doesn’t show you, which matters as much. All details are as of October 2026, and GetYourGuide renames portal features often. For the wider picture of selling on the platform, see our GetYourGuide operator guide.
Key Takeaways
- GetYourGuide analytics now sit under Performance in the Supplier Portal. “Analytics” became Performance and “Insights” became Recommended Actions in the spring 2026 release, and data updates daily.
- Start with the business view: sort your products by revenue, then by conversion rate. The product that earns well but converts badly is usually the best place to start.
- Read each product’s Conversion & bookings tab as a funnel. Few impressions, few clicks and few bookings each point to different GetYourGuide settings.
- GetYourGuide defines conversion as bookings relative to page views, and it feeds ranking. There’s no public benchmark, so compare products, years and before-and-after changes.
- The dashboard doesn’t show your net revenue per booking, your ranking position or competitors’ figures. A good month in Performance can still be a bad month for the business.
Where to Find GetYourGuide Analytics
Open the Supplier Portal and select Performance from the main menu. This is the screen most operators still call the GetYourGuide analytics dashboard. The menu runs Home, Create, Manage, Bookings, Performance, Finance, Profile and Help.
GetYourGuide’s help article on the Performance section describes two views:
- Business performance: key metrics for all your products together, with a table that breaks them down by product.
- Product performance: one activity at a time, with tabs for each metric area and a funnel view. Open it with View details in the product table.
You can change the date range, set a custom one, and switch on a year-over-year comparison from the dates filter. Next to each metric name there’s an “i”. Hover over it for GetYourGuide’s definition of that metric. Those tooltips are the only place GetYourGuide defines its terms, so read them once before you trust any number.
The change from Analytics to Performance wasn’t only a rename. GetYourGuide’s spring 2026 release notes say analytics and suggested actions used to sit in separate parts of the portal. Now they’re on the same screen, so the numbers and GetYourGuide’s suggestions for each product sit side by side.
Start With the Business View
The business view answers one question: which products deserve your time this month. Sort the product table twice; that’s the quickest way into your GetYourGuide analytics.
First, sort by revenue. That’s where your GetYourGuide income actually comes from.
Then sort by conversion rate. A product near the top of the revenue list and near the bottom of the conversion list is usually the best opportunity you have. It already gets traffic. It’s losing more of it than it should.
Take a hypothetical Galway operator, Niamh, with four activities on GetYourGuide. Her Cliffs of Moher day trip brings in the most revenue. Sorted by conversion, it comes last, converting at roughly half the rate of her other three.
Nothing about the tour itself has changed. The product page tells her why: the trip’s first photo is a coach at a car park, and the description doesn’t mention until the fourth paragraph that the tour stops at the cliffs for two hours. Her other listings open with the view and the timings.
That’s the pattern to look for: a product with demand and a listing that wastes it. Low-revenue, low-conversion products can wait.
Switch on year-over-year before you draw conclusions. A seasonal product that looks weak in October may be doing better than last October.
Read the Product View as a Funnel
Open a product and go to the Conversion & bookings tab. GetYourGuide shows each step from search to booking as a funnel, with the numbers at each stage. The help article lists the funnel metrics as impressions, click-through rate and page visits, ending in bookings.
Each stage fails for different reasons, and each points to different settings on GetYourGuide:
| Where the funnel is weak | What it usually means | What to check on GetYourGuide |
|---|---|---|
| Few impressions | The activity isn’t showing in many searches | Availability (GetYourGuide wants bookable dates at least a year ahead and bookings up to start time); category; cancellation and no-show record; whether activities were temporarily removed |
| Impressions but few clicks | Travellers see the card and pick another | Title (location first, category named, no prices or capitals); first photo; price against similar activities; rating and review count |
| Visits but few bookings | The page doesn’t convince | Description; options and inclusions; cutoff time; meeting point; what recent reviews say |
| Bookings but low revenue | The money per booking is low | Option mix; group pricing; special offers you’re running |
Our guide to optimising your OTA listing covers the general diagnosis. The sections below are the GetYourGuide-specific part.
Few impressions
Impressions are the first number to fall when GetYourGuide has less reason to show you. Check availability before anything else. GetYourGuide’s ranking help article says an activity should be bookable at least a year in advance and ideally up to its start time, because more open dates mean more searches you can appear in.
Then check your cancellation and no-show rates. Activities that keep missing GetYourGuide’s limits (1.0% and 0.2% over 90 days) can be temporarily removed, which takes impressions to zero.
Impressions but few clicks
If impressions are healthy and the click-through rate is low, the problem is the activity card: title, first photo, price and stars. GetYourGuide’s quality guidelines require titles to start with the location and name the category, with no prices, discounts or capitals. The first image has to be high quality, relevant and the right way up.
Consider a hypothetical e-bike tour in Rome, run by Sofia. Her impressions were steady but her click-through rate was well below her walking tour’s. Her title opened with “Unforgettable!” and the first photo was a close-up of the bike.
She changed the title to start with “Rome:” and name the tour type, and swapped the first photo for riders at the Colosseum. Clicks recovered within a few weeks. The tour hadn’t changed. The card had.
For the photo side, see our guide to OTA listing photos.
Visits but few bookings
Plenty of page visits and few bookings means travellers are reading and leaving. The usual causes are a description that buries the practical details, confusing options, a cutoff that rules out last-minute bookers, or recent reviews mentioning the same problem.
Since spring 2026 you can edit the title, description, photos, itinerary and meeting point directly from the product page, without going back through the full creation flow. Note the date of every change. Without dates, you can’t tell later which edit moved the numbers. Our guide to writing an OTA product description covers the page itself.
GetYourGuide Conversion Rate: What It Measures
GetYourGuide defines conversion rate as the number of bookings relative to page views. It’s one of the main inputs to ranking: GetYourGuide’s help centre says it measures activity performance by revenue and conversion rate, alongside availability and review score. A product that converts well climbs, gets more views and converts more, as our guide to how OTA ranking algorithms work explains.
What you can’t do is compare your GetYourGuide conversion rate against an industry figure. There’s no reliable public benchmark for tours and activities, and the “average conversion rates” on vendor blogs rarely say where they came from. Our guide to measuring OTA performance explains why.
The comparisons that work:
- Product against product. If one activity converts at half the rate of another, find out why.
- Year on year. The same weeks last year, using the year-over-year toggle.
- Before and after a change. Three or four weeks either side of a dated edit.
Source Markets and Booking Window
These two metric groups get less attention than they deserve, because they tell you when and how to sell, not just how much.
Source markets
Source markets show where your customers come from. Use them to check that your listing works for the people actually booking it. If a market is growing, read your listing as that traveller would. GetYourGuide requires listing content to be written in the language you selected for it, so a growing non-English market is a reason to check how your listing reads to someone outside it.
Booking window
Booking window shows how far ahead customers book. A long booking window means your calendar needs dates loaded well in advance, or you miss travellers who plan early. A short one means your cutoff time matters: GetYourGuide’s ranking guidance says activities should ideally be bookable up to the start time. If most of your bookings arrive within 48 hours and your cutoff is the day before, you’re turning away the bookings you’re most likely to get.
Ratings, Cancellations and Recommended Actions
The GetYourGuide Performance section also shows your customer feedback (average rating, number of reviews, percentage of low ratings) and your cancellation and no-show rates. Recommended Actions appear at the bottom of the business and product pages. We cover all three in our guide to the GetYourGuide Provider Rating, including GetYourGuide’s limits and which actions to do first.
One warning bears repeating here. Recommended Actions are GetYourGuide’s suggestions, and they’re designed to lift conversion and revenue on GetYourGuide. A suggestion to add a special offer may well raise your conversion rate and lower what each booking leaves you after commission. Treat them as prompts, not instructions.
What GetYourGuide Analytics Don’t Show You
The Performance section measures what matters to GetYourGuide. Some of what matters to you isn’t there, and Viator’s analytics have the same gaps.
- What you keep. GetYourGuide’s help pages don’t say whether the revenue figure is before or after commission, so check the “i” tooltip in your account. Either way, it may not show promotions you funded, and it won’t show your own costs per booking. At a 25% to 30% commission, the gap is large. Use our OTA commission calculator to see your net per booking.
- Your ranking position. GetYourGuide doesn’t show where you appear in search, and its ranking is personalised to each traveller.
- Competitors’ numbers. The Competitor Report (in limited testing) compares your listing content with similar activities, but not their conversion or revenue.
- Why a number moved. The dashboard shows that conversion fell. It doesn’t say whether that was your listing, a competitor, the season or a ranking change.
I learned this one the hard way. One August, every GetYourGuide number I looked at was up: bookings, revenue, conversion.
It was only when the invoice arrived that I saw how much of that revenue had gone on a promotion we’d agreed to in June and forgotten to switch off. The dashboard had shown a great month. The bank account showed an ordinary one.
That’s why the monthly scorecard in our OTA performance guide puts net revenue per ticket next to the platform’s own numbers.
A 15-Minute Monthly Routine
Once a month, on the same day:
- Open Performance with the same date range as last time, and switch on year-over-year.
- Sort the product table by revenue, then by conversion rate. Note any product high on the first list and low on the second.
- Open that product’s Conversion & bookings tab and find the weakest stage of the funnel.
- Fix one thing at that stage, using the table above, and write down the date.
- Check source markets and booking window against your availability and cutoff times.
- Clear or dismiss Recommended Actions older than 30 days, after checking what each one does to your margin.
- Copy the headline figures into your own scorecard, next to net revenue per ticket.
Next month, step 4 tells you whether last month’s change worked.
Questions About GetYourGuide Analytics
How often is GetYourGuide analytics data updated?
Once a day, according to GetYourGuide’s help centre. Don’t expect to see the effect of a change made this morning until tomorrow at the earliest, and give any listing change a few weeks before judging it.
Can I export GetYourGuide analytics?
When GetYourGuide launched its analytics dashboard in 2024, it said reports could be downloaded. The current help article for the Performance section doesn’t mention exporting, so check your own view for a download option. If there isn’t one, copy the monthly figures into a spreadsheet by hand.
Can I see competitors’ conversion rates on GetYourGuide?
No. GetYourGuide’s supplier dashboard shows only your own figures. The Competitor Report, available to a limited set of activities, compares your listing’s photos, reviews, content, options, inclusions and suitability with three to six similar activities, but it doesn’t show their numbers.
Start With Your Weakest Funnel Stage
Open Performance today, sort your products by conversion rate, and open the lowest one that still earns real revenue. Find the stage where the funnel drops, fix one thing there, and note the date. That’s a better use of fifteen minutes than reading every metric on the page.
GetYourGuide analytics show you what’s happening on GetYourGuide. Keep your own record of what it leaves you, and you’ll have the whole picture.







2 Comments